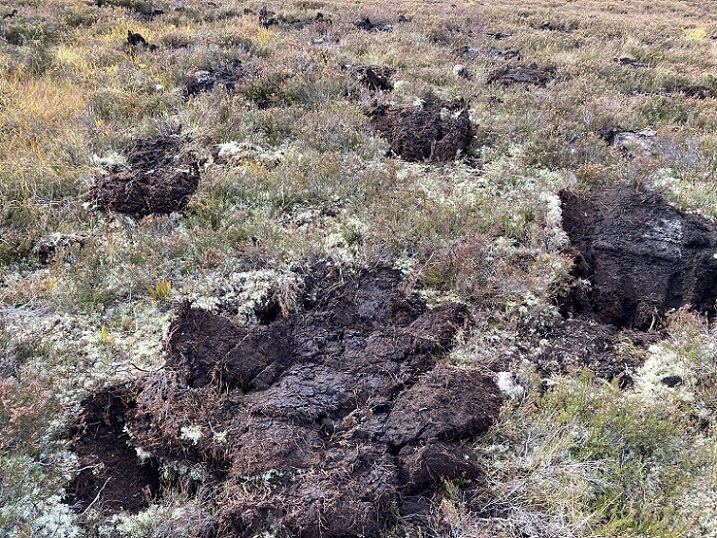
The Woodland Carbon Code (WCC) takes a very different to measuring the carbon stored in soils and the carbon stored in wood. As my first post in this series explained (see here), the WCC calculator reduces the multiple different types of soil to just two categories, mineral and organo-mineral, and almost completely disregards the evidence from soil science about the impact of planting trees on Soil Organic Carbon (SOC). This post explains how, by contrast, the WCC calculator measures the potential carbon units stored by trees by individual species and how this re-inforces the plantation model which dominates forestry practice in Scotland.
The Forestry Commission and its successors have for years been researching how best to improve the yield of trees, i.e the amount of timber produced for a given area. An important part of this forestry science has been consideration of soils but from a timber production, rather than a SOC or nature conservation, perspective. This has resulted in the ‘Yield Class’ system (see here):
‘an index used in Britain of the potential productivity of even-aged stands of trees. It is based on the maximum mean annual increment of cumulative timber volume achieved by a given tree species growing on a given site and managed according to a standard management prescription. It is measured in units of cubic metres per hectare per year.’
It was a short step for the Forestry Commission to convert the cubic metres of wood produced by tree growth for different species into carbon units, which are measured as tCO2 absorbed from the atmosphere. The methodology the FC adopted to convert tree biomass (including roots, main stem, branches and foliage) into carbon is set out in their Carbon Assessment Protocol produced in 2018 (see here). The WCC then incorporates that methodology into their calculator (see here for version 3) and uses it to predict how much CO2 planting new woodland could absorb from the atmosphere.
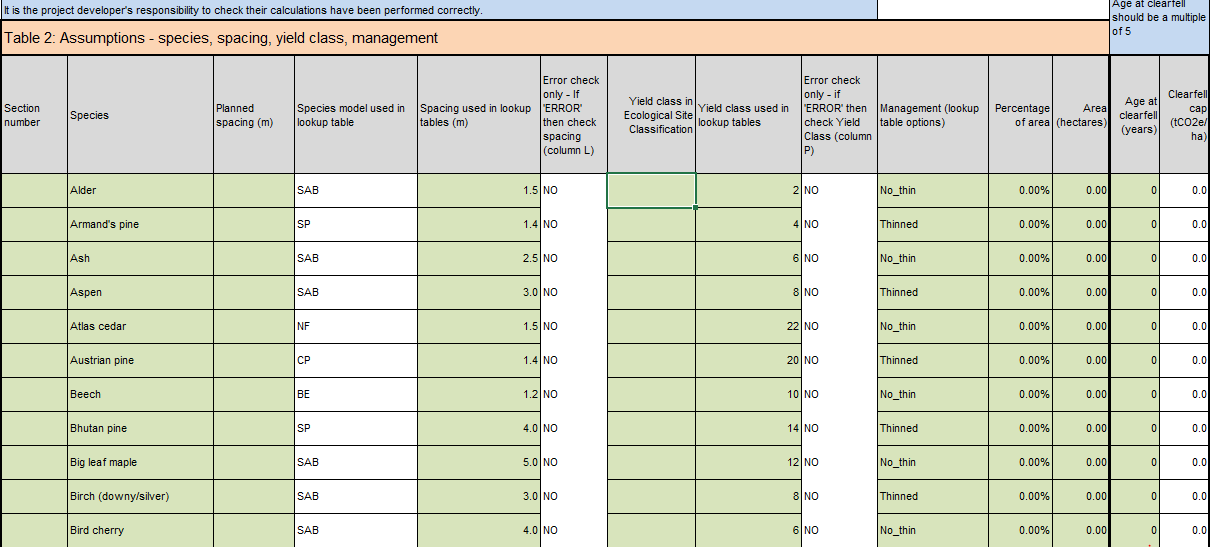
Having chosen what trees to plant, for each species (first column) the WCC calculator enables the landowner/manager to work out how many carbon units it will produce given the proposed spacing of the trees, the predicted yield class and whether the trees will be thinned or not.
Depending on the species of tree chosen, the look up tables present specific spacing and yield class options. These vary by individual species. For example, Norway spruce has just one spacing option, 1.5m and the yield class ranges from 6-18, whereas for Scots pine the spacing options are 1.4m, 2m, 2.5m, 3m, 4m and 5m and the yield class ranges from 2-14. While there is in theory nothing in the WCC that prevents woodland developers choosing a different spacing model (column 3), the calculator effectively incentivises woodland developers who wish to sell easily verifiable carbon units to make choices which have been researched and tested by forestry science.
Once a woodland ‘developer’ has filled in the assumptions in Table 3, the WCC calculator spreadsheet combines this with Table 3 on Soil Carbon Emissions (the subject of my first post) and Table 1, on Establishment Emissions (which are treated as being less significant but will be considered in a further post) to produce a ‘Summary of Carbon Sequestration over time’: This shows the “long-term average carbon stock that is projected to accumulate on the site”:
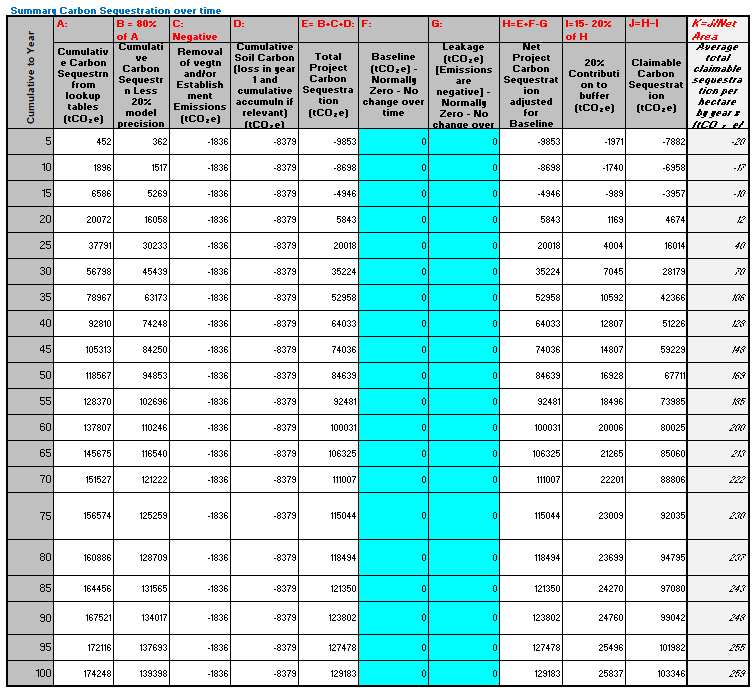
The Carbon Sequestration table adopts a conservative approach to estimating the amount of Carbon Units which will be produced by planting trees.
First it subtracts 20% (Column B) from the calculations in Column A about how many tCO2 will be absorbed from the atmosphere over time. If the initial prediction of Carbon Units are later verified by an independent body over time (checks happens five years after planting and then every ten years thereafter) they too can be sold. In theory the 20% should allow for tree planting failures. However, at BrewDog’s Lost Forest at Kinrara, Scottish Forestry found in 2023 that c50% of Scots Pine and c95% of mixed broad-leaves died (see here). Luckily for the WCC, the scheme was only validated in 2025 – i.e after the dead trees had been replaced – and as a consequence the documentation on the UK Carbon Registry (see here) makes no reference to this disaster.
Second, the calculator subtracts a further 20% (Column I) as a permanent buffer to safeguard against over-predicting the amount of carbon absorbed by trees, uncertainty within carbon science and other miscalculations.
From a tree growing perspective, this is all very impressive and it is little wonder that Scottish Forestry and the wider forestry industry as represented by Confor believes the WCC is innovative and deserves awards. The problem is however good the WCC is at calculating the carbon absorbed by trees, the fact is that far more carbon is stored in soils and the WCC is extremely poor at measuring how much of that might be released back to the atmosphere as a result of planting. Whether the 20% buffer in the calculator is sufficient to offset the WCC’s failure to incorporate the scientific research on carbon emissions from soils is the crucial point. If not, the whole of the WCC faces collapse.
The implications of the WCC calculator for tree planting
The first three assumptions behind the WCC are that woodland helps remove carbon from the atmosphere, disregarding organic soils, that planting trees is the best way to expand woodland, disregarding natural regeneration and that private investment is required to do this, disregarding non-market alternatives.
From a private investor perspective, whether or not their primary objective is to help offset their own carbon emissions or to make money makes little difference. The first question of any investor to any woodland adviser is likely to be either how they can offset the most carbon or how can they make the most money. There are three main elements to the answers provided by the WCC calculator.
Species of tree
Sitka is generally the fastest growing tree grown in Scotland and therefore, on short to medium term timescales, converts more CO2 into wood than any other species. This is reflected in the WCC calculator where the range of yield class options for Sitka is 6-24 compared to 2-14 for Scots Pine. The average yield class for Sitka, as reported by Forest Research is 12-14 compared to 8 for Scots Pine. Sitka, already by far the most widely planted tree in Scotland, would therefore appear a no brainer from a carbon perspective.
The WCC, however, is designed to promote new woodland while forestry regulations require existing plantations to be replanted after felling (except where they are on peat over 50cms deep). These requirements have acted as a constraint on market demand along with the various regulations and the UK Forestry Standard which help limit where new Sitka plantations could be created. Nevertheless the recent proliferation of Sitka schemes on moorland and former farmland in the borders (e.g Stobo Hope (see here) and Todrig) appears to be partially being driven by the opportunity to make money from the sale of Carbon Credits as well as timber sales (I will consider this further in future posts).
The constraints on planting Sitka and other fast growing non-native conifers like Norway spruce (yield class 6-18) and Douglas fir (yield class 8-20) has incentivised the planting of Scots Pine in areas like the Cairngorms National Park. Table 2 for the Kinrara NWC Phase I scheme provides an example:
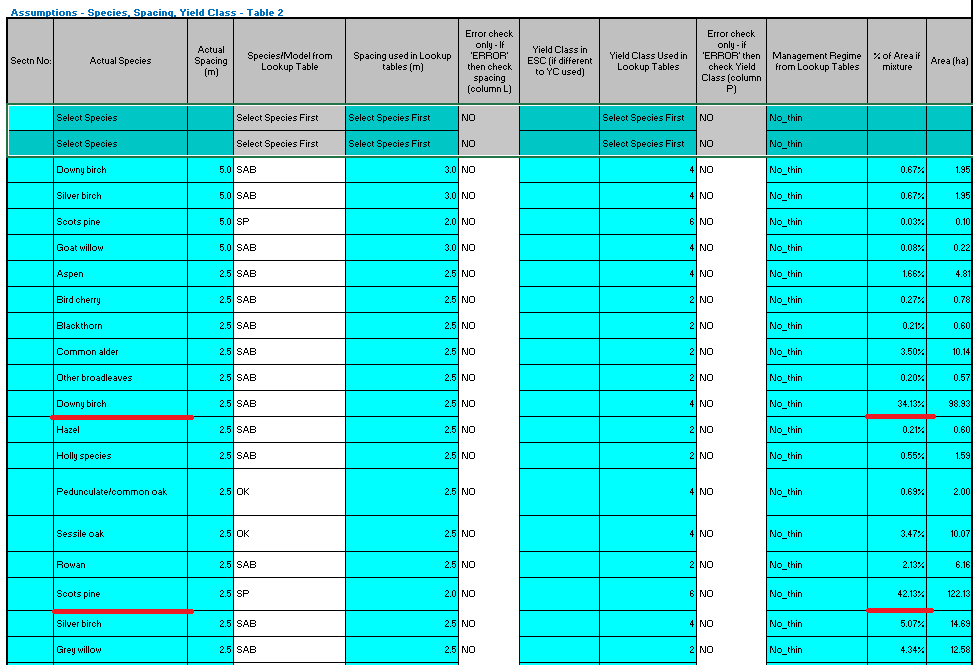
While the range of yield classes for Scots pine (2-14) is only slightly more than for other species (Downy and Silver birch are 2-12) , the average yield if trees are closely spaced is higher at around 8 compared to 4 for Downy birch (see here). While that for Silver birch is slightly higher, Downy birch grows better on less well-drained soils. Combine this with the economies of mass production in tree nurseries, from a carbon and financial perspective Scots Pine is the next best alternative to non-native conifers with Downy birch often the favoured broad leaf.
From a carbon and financial perspective, the primary reasons that other native species are planted are to meet the UK Forestry Standard and to give the appearance that the WCC also promotes biodiversity. Those other native species, however, are not what drive investment decisions using the WCC calculator. Hence why so many native woodland schemes registered under WCC predominantly comprise of Scots pine and either Downy or Silver birch. These are the commonest species of native tree in upland Scotland and if grazing levels were reduce would spread rapidly through natural regeneration without any need to plant.
This is not to claim that the carbon units generated by planting other tree species might not create a useful source of income for conservation-minded landowners looking to fund the creation of different types of woodland. For example there are some riparian woodland schemes which have been planted with species other than Scots pine and birch, registered under the WCC . There are some WCC schemes which predominantly involve planting species other than Scots pine and birch. Such schemes, however, tend to be smaller than investor led schemes and every much in the minority.
Woodland structure
While in theory the WCC allows for different approaches to growing trees, including natural regeneration, in practice the amount of carbon absorbed by tree growth outside of plantations is very hard to measure. As Forest Research puts it ‘Yield class is an index used in Britain of the potential productivity of even-aged stands of trees. It is based on the maximum mean annual increment of cumulative timber volume achieved by a given tree species growing on a given site and managed according to a standard management prescription.’ They go on to explain the limitations:
‘The yield tables are designed mainly for application to even-aged silvicultural systems. They have limited application to forest stands with more complex structure and silvicultural practice, for example uneven-aged stands of trees – this is a subject of ongoing research and development. A characteristic stand growth pattern and a particular management prescription have been assumed in the construction of each yield table. Any deviation from the assumed growth pattern or management prescription will result in different stand characteristics compared with predictions.’
As a consequence, while the WCC calculator is able to convert predicted yield into Pending Issuance Units (PIUs) and predicted carbon units for even aged plantations with a reasonable degree of accuracy, anything else is far more challenging to count and convert into a financial value. In the case of natural regeneration, predicting when and how many saplings will become established is more than an art than a science which then requires intensive surveys on the ground to determine, tree by tree, how much carbon has been stored in wood.
Any landowner wanting therefore to sell easily verifiable woodland carbon units is likely to be advised to stay away from natural regeneration and plant as many trees as possible at the same time. And if that planting involves relatively few species, the counting is made even easier – another reason why so many native woodland schemes mainly comprise of Scots pine and birch.
For investors wishing to maximise their financial returns, the WCC calculator also leads to the use of spacing options which research shows maximises yield, while at the same time meeting the UK Forestry Standard which requires foresters to leave a certain amount of open space and more natural areas. This explains why in Table 2 for Kinrara Phase 1 above, a small proportion of the Scots pine, Downy and Silver birch were planted 5m rather than 2.5m apart. There is also an incentive for investors to plant trees that grow upwards, like Scots pine and birch, rather than spreading outwards, like willow and hazel, because upward growing trees produce more wood carbon per square metre of ground.
The overall outcome of the WCC calculator incentivising investors to plant the same two or three evenly aged and closely spaced native species are new native woodland plantations which appear little different from anything that would be planted by the commercial timber industry.
Protecting trees and promoting tree growth
For investors wishing to maximise wood carbon and financial returns, it also makes sense to adopt the methods adopted by the commercial timber industry to maximise yield so long as the carbon costs of doing so do not outweigh the benefits. The carbon costs of these methods are incorporated into in Table I of the calculator on Establishment Emissions and include fencing, the removal of vegetation, the use of herbicide and plastic tree shelters.
The methods also includes ground preparation, such as mounding, which are listed in Table 3 and, like other carbon emissions caused by planting on organic soils, are only allowable because the WCC calculator like the UK Forestry Standard fails to account for them properly.
How the WCC calculator drives plantation forestry
The WCC calculator is based on the assumptions that woodland is an important means of removing carbon from the atmosphere and that planting more trees is the way to achieve this. The calculator contains lots of clever stuff, founded in forestry science, which establishes how much CO2 each species of tree or mix of species absorbs from the atmosphere each year and how to maximise this. It then converts the result into tradeable into carbon units..
This provides a means of measuring the potential carbon benefits of each WCC scheme case by case and at first sight appears robust.. The underlying logic, however, is to add to the drive by the commercial forest industry to plant sitka and to incentivise the planting of native trees in plantations. Hence the industrial scale planting at Kinrara and Far Ralia in the Cairngorms National Park.
Given the lead role of Scottish Forestry, It should come as little surprise that the WCC calculator promotes similar types of forestry and forestry practices to the Scottish Forestry Grants system. A future post will explore the relationship between these two systems further.

As a footnote to your article Nick… I worked on Yield Class predictions for Sitka and other species back in the day. and published a few articles on the subject. Here are some comments: 1. Yield Tables for different species and spacings are not reliable as they are often based on 1 or 2 sample plots, and a great deal of extrapolation. 2. Yes, Sitka is the fastest growing species across most sites, but the gap is greatest on peaty soils – exactly the kind of soils that will lose lots of carbon if planted with Sitka. Other species almost grow as quickly on better ground – especially Douglas Fir. Unfortunately crude algorithms used by corporations will ignore this and choose Sitka evert time. In the old days a good forester would plant Douglas on freely draining brown earths in sheltered locations because of its superior timber qualities because growth difference were not that pronounced. As you say carbon finances are compounding the planting of Sitka everywhere mantra of industrial forestry..
For a bit of context on Yield Class models: while any book of forest mensuration tables shows a wide variety of potential models for the main conifer species, the broadleaved species are not really that well understood at all, with sycamore, ash and birch (three very difference species) all bracketed together in the same tables. So, the background/ historic understanding of the mensuration dynamics of broadleaves was never given that much consideration prior to these new calculators etc. There is very little to verify the metrics of broadleaved species production, and what we now have has to be viewed through the prism of carbon calculations. Indeed, the entire scientific underpinning of all this stuff is very shaky indeed, and anyone investing in carbon trading needs, in my opinion, to give themselves a good shake. Of course, they tend to be investing other people’s money, so the real checks and balances normally brought about by critical scrutiny do not really apply. There will however be a “market correction” at some point, and not much sympathy for those holding the credits when the music stops.